Autonomous Marine Robotics Manufacturer
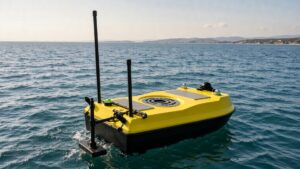
Seabed Mapping USV: Field Notes From a 38 km² Coastal Block
Eleven days, two people, 38 km² of coastal seabed. What the multibeam handled, what the subsea vehicle had to finish, and the sound-velocity error that cost half a day.

Eleven days, 38 km² of seabed between the 12 m and 34 m isobaths, and a survey crew of two. That was the brief. A seabed mapping USV flew the multibeam across the outer block while a tethered subsea vehicle worked the four anomaly clusters that the surface sonar could see but not resolve. Throughput held at 3.4 km² per hour in sea state 2, and the delivered grid went out at 0.9 m bin size — inside the 1 m the tender allowed.
Two people on the water, for eleven days, with no second boat.
Where the multibeam stopped and the subsea vehicle started
Surface multibeam buys breadth cheaply. A 400 kHz head with a 120° swath paints roughly 3.5 to 4.5 times the water depth per pass, so one line over 25 m of water covers about 100 m of seafloor. What it cannot do is separate a 1.8 m boulder from a 1.8 m length of wreckage sitting in an acoustic shadow, or show the first 3 m of sediment beneath a cable corridor.
So the block ran in two passes: broad coverage first, anomaly list second, close inspection third.
Handing off costs 2–3 minutes per anomaly on a calm day — recovery, launch, log, redeploy. Four anomalies ate most of one afternoon here and produced the only two findings the client acted on: a 40 m run of derelict chain across the alignment, and a scour pit 1.4 m deep under a pipeline crossing.
What a seabed mapping specification actually fixes
Multibeam bathymetry refers to depth measured as a dense swath of beams fanning across the vessel track, rather than a single sounding under the hull. That distinction sets your coverage rate, your bin size and your price, and it is the first thing to check in a scope of work.
Depth uncertainty and object detection are separate clauses, and buyers conflate them constantly. IHO S-44 Order 1a asks for total vertical uncertainty of 0.5 m in 0–100 m of water plus feature detection at 2 m; Order 1b relaxes the feature size to 5 m without loosening depth. We cite the order by number and leave it unlinked on purpose — the issuing body’s site serves a cookie challenge instead of a page, and a citation that 404s for the reader is worse than plain text.
Planning started on existing grids rather than on the water. The GEBCO gridded bathymetry product runs at 30 arc-second, roughly 900 m at this latitude, and the EMODnet bathymetry compilation covers European waters at similar resolution. Both told us where the terrain was probably featureless, and we spent fewer swath hours there.
The scope also fixed what had to leave the office: a 0.9 m CUBE surface, a feature list carrying position and least depth for everything above 1 m relief, and contours at 1 m intervals. Ask for the feature list by name. Suppliers routinely hand over a handsome grid with no attributed targets, and a grid alone will not tell a dredging contractor where the steel is.
The two vehicles we put on the water
Surface unit
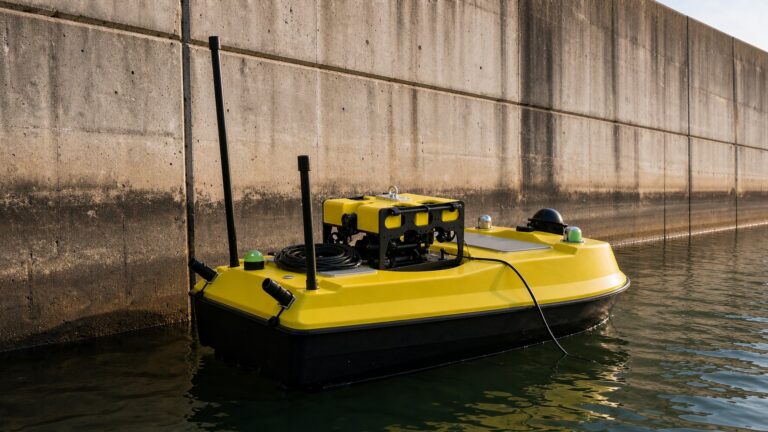
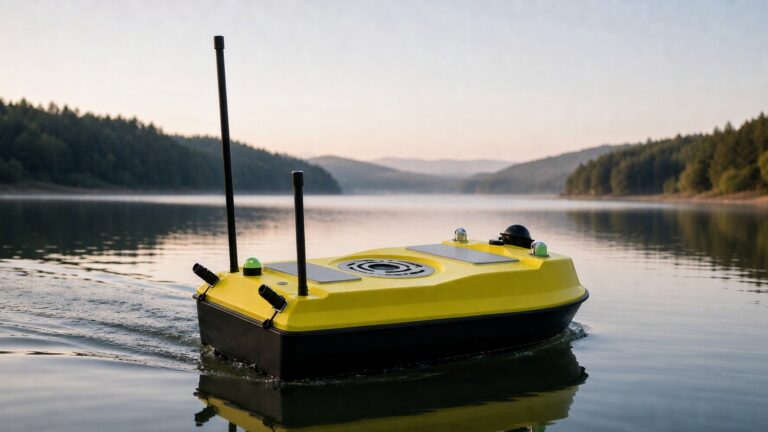
The platform was an XHS50-ADCP hull: 1.2 m monohull, black fender, yellow deck, multibeam head on a through-hull pole rather than a gondola. Through-hull wins here. No draft penalty, no chance of striking the pole on an uncharted shoal, and the transducer stays in clean water between 4 and 6 kn. The trade is that you cannot swap heads mid-campaign without hauling out.
Subsea vehicle
Beneath it, an XRV4 open-frame work-class ROV on 500 m of umbilical took the close inspection work: 900 kHz side-scan and a sub-bottom profiler along the cable corridor. A free-swimming AUV would have covered the four anomalies faster, and it would also have come home without telling us why a target was a target. Our AUV versus ROV comparison goes further into that trade.
Positioning and data chain
Everything rests on three inputs: GNSS with RTK correction, a fibre-optic IMU for heave and attitude, and a sound-velocity profile taken at the transducer face. Horizontal position held 0.04 m at 1σ on this job. Attitude is what quietly ruins a swath — 0.05° of residual roll at 30 m of depth displaces the outer beams by roughly 0.13 m, which is a third of the allowable uncertainty gone before the sonar is considered at all.
What went wrong on day four
Day four began at 06:40 with a sound-velocity cast reading 1,498 m/s at the surface. By 11:00 the surface layer had warmed and that cast was stale. Nothing alarmed. The swath looked normal on the acquisition screen, because it always does.
Cross-lines caught it. Disagreement between main-scheme lines and the two cross-lines had drifted to 0.31 m, up from 0.19 m on day two, and the bias grew toward the outer beams. That pattern is the signature of a velocity error rather than a positioning error, and re-casting at 11:20 pulled the next four hours back to 0.16 m.
Two hours of line work went in the bin, and nobody was to blame for it.
Diagnosis took about 40 minutes. Pull the two cross-lines into a difference surface, watch the error fan outward with beam angle, check it against the cast timestamp. A positioning fault looks different — it shifts the whole line laterally instead of bending its edges.
What saved the day was the cross-line schedule, not the hardware. One cross-line every twelve main-scheme lines is the minimum I would write into a contract; without it the 0.31 m drift would have surfaced at delivery, three weeks later, as a client complaint with no obvious cause.
Coverage we logged against the tender
Figures below come from the acquisition logs, not from a sales sheet.
| Measure | Logged on this block | Tender requirement |
|---|---|---|
| Area per 8-hour shift | 26.8 km² | ≥ 20 km² |
| Grid bin size | 0.9 m | ≤ 1.0 m |
| Cross-line disagreement | 0.19 m at 1σ | ≤ 0.30 m |
| Anomalies inspected subsea | 4 of 4 | all features above 1 m relief |
| People on the water | 2 | not specified |
Two rows need context. The shift rate beat requirement because this block had no anchorage and no traffic separation scheme; in a working harbour the same crew logs closer to 14 km² a shift. Crew of two is not a staffing boast either — it is what the platform allows, and it is the line item that decides whether a small block is viable at all.
When a USV plus UUV pairing is the wrong answer
Three conditions break this approach, and a buyer can test for all of them before writing a scope. In under 3 m of water the swath collapses to a few metres either side and weed fouls the transducer constantly. Above roughly 2.5 kn of current the surface unit stops holding line, and the spread turns into a recovery exercise. Below about 2 km² the mobilisation dominates: the ROV spread will cost more than the survey is worth, and a single-beam hull with a side-scan towfish returns an adequate product at perhaps 40% of the day rate.
There is a quieter mismatch too. Some clients want a picture, not a dataset. If nobody on the receiving side can read a 0.9 m grid, a 4 m grid and a PDF chart will satisfy them for less money, and selling them bathymetry is a service to nobody.
Where the deliverable is defensible, public programmes are the cheapest place to learn what one looks like — NOAA Ocean Exploration publishes mapping outputs and acceptance notes from its own campaigns. Beyond that, the marine and water conservancy programme notes cover the wider deployment envelope, and buyers writing a first scope should work through our guide to buying an unmanned surface vehicle before specifying payloads.
Frequently asked questions (FAQ)
How accurate is seabed mapping from a USV compared with a manned survey launch?
Accuracy comes from the sonar and the positioning, not from the platform. A USV running RTK GNSS, a fibre-optic IMU and a calibrated multibeam meets IHO S-44 Order 1a in 0–100 m of water, and this block held 0.19 m cross-line disagreement. What the unmanned platform removes is operator line-keeping error across long shifts.
Can one USV carry a multibeam head and a sub-bottom profiler at once?
Yes, but the two compete for deck space and for clean water. A 400 kHz multibeam wants a through-hull mount, while a sub-bottom profiler wants a low-frequency array clear of bubbles and often towed. Most operators either run separate passes or move the profiler onto the subsea vehicle, which is the arrangement used here.
How deep can the subsea vehicle work below the surface unit?
The XRV4 is rated to 500 m, so the practical limit is the umbilical and the launch arrangement rather than the pressure hull. Over a 34 m block the tether never paid out beyond 41 m. Deeper inspection is a different vehicle class with a different day rate.
What does a seabed mapping USV campaign cost to run?
Budget by day rate plus mobilisation rather than by square kilometre. Two people, one surface unit and one ROV spread worked eleven days on this 38 km² block, weather included. Add processing at roughly 0.6 to 0.9 days per acquisition day, and ask the supplier for configuration pricing instead of expecting a list figure.
An inland version of the same split, in 30 m of fresh water, is written up in our reservoir and water resource assessment report.