Autonomous Marine Robotics Manufacturer
Water Resource Assessment USV: Survey and Evaluation Guide
A water resource assessment USV resolves storage volume to within 2% of capacity, maps sedimentation at ±0.05 m and profiles water quality at 30+ stations.

For basin authorities, water utilities and hydrology bureaus, the case for a water resource assessment USV is arithmetic rather than novelty. One 8-hour sortie covers 3–5 km², resolves storage volume to within 2% of capacity, holds sedimentation accuracy at ±0.05 m, and profiles water quality at 30+ stations a day. The same hull then carries a 300–500 m class ROV to inspect submerged outlets and dam faces, so a single mobilisation returns both the volume model and the asset-condition record.
Key takeaways
- A water resource assessment USV surveys 30–60 line-km per day; a 10 km² impoundment closes in 2–3 field days.
- RTK GNSS at ±2 cm paired with a calibrated echo sounder at ±0.05 m keeps storage-volume error below 2% of capacity.
- Adding an ROV to the same campaign extends coverage to outlets, intakes and dam faces to 500 m depth, with no second mobilisation.
- Storage-elevation curves, sedimentation maps and water-right verification data export as IHO S-44 compliant records within 24 hours.
- Five-year total cost of ownership typically runs 40–60% below crewed-boat campaigns once crew, fuel and safety overhead are counted.
What the platform must deliver in practice
Water resource assessment is the systematic measurement of water volume, quality and underwater terrain across a basin, producing the quantitative basis for water-right confirmation, allocation and withdrawal-permit management. The specification therefore has to satisfy three parties at once: the hydrographer who signs the survey, the regulator who audits the permit, and the engineer who runs the allocation model. Accuracy, daily coverage and reporting-chain integration are what actually decide the tender — not hull speed or payload count.
| Mission parameter | Typical requirement | Why it matters |
|---|---|---|
| Positioning | RTK GNSS, ±2 cm horizontal | Ties every sounding to a legal coordinate |
| Bathymetric accuracy | ±0.05 m or 1% of depth | Keeps volume error under 2% |
| Daily coverage | 3–5 km² or 30–60 line-km | A 10 km² reservoir finishes in 2–3 days |
| Endurance | ≥ 8 h per battery set | One sortie per working day |
| Water-quality profiling | CTD plus sampler, 30+ stations/day | Vertical profiles support allocation models |
| ROV depth rating | 300–500 m class | Covers deep outlets and dam faces |
Platform and payload configuration
Surface platform
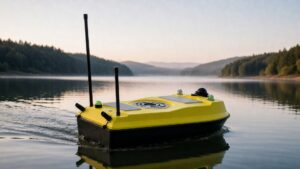
The baseline platform is a twin-hull catamaran of 30–60 kg carrying 15–25 kg of payload, with draft under 0.3 m and station-keeping within 0.5 m RMS. Two people launch it from a slipway or bank ramp in under 20 minutes; no crane is needed below the 60 kg class, which is the single biggest determinant of whether a field team actually uses the system on a routine basis. Course-keeping against 1.0–1.5 m/s currents covers reservoir headwater inflows.
Subsea vehicle
For inspection tasks, a compact open-frame ROV in the 300–500 m depth class deploys from a deck davit. It carries an HD camera, lighting rated for turbid water and, optionally, a scanning sonar for zero-visibility outlets. Because the vessel is already on station and already positioned to centimetre accuracy, the inspection inherits the survey control rather than re-establishing it — a detail that saves 3–5 days per campaign compared with a separate dive mobilisation, and avoids putting divers into an intake throat at all.
Sensor and data chain
The payload is built from commercial instruments rather than proprietary ones, which keeps calibration and spares local. Multiparameter sondes — YSI EXO, In-Situ Aqua TROLL and Eureka Manta all mount to the same quick-release frame — cover temperature, conductivity, pH, dissolved oxygen, turbidity and chlorophyll-a; an ADCP profiles velocity for discharge and sediment-transport work; a 2–5 L sampler collects the bottle that laboratory verification depends on; a hydrocarbon fluorometer is available where an industrial outfall sits inside the survey area. Every channel is time-stamped at 1–10 Hz, so volume, quality and position resolve into one record instead of three spreadsheets.
Telemetry runs over 4G/5G with a 10 km radio fallback, and exports land in the formats bureaus already use — CSV, GIS layers, and direct hand-off to ESRI ArcGIS or AQUARIUS. Onboard quality control flags sensor drift and position dropouts before the data leaves the boat. The data architecture is the same one used in the real-time water quality monitoring workflow, which is why a bureau can add a survey function without standing up a second data pipeline.
Three programme shapes that define the requirement
Procurement documents are usually written from one of three real programme shapes. These are the numbers those programmes have to hit.
Storage verification on a large impoundment
A 10 km² reservoir needs its storage-elevation curve rebuilt after a flood season, because sediment has moved and the allocation model is now wrong. The uncrewed campaign runs 2–3 field days of bathymetry plus 1–2 days of ROV targets, against roughly three weeks for a crewed boat working the same grid in daylight and weather windows. The output is a volume figure defensible to 2% of capacity, a sedimentation map at ±0.05 m, and a by-product: the same pass shows where silt has built up in front of the intake.
Drinking-water intake protection
A utility running a 5 km² drinking-water reservoir on a weekly cadence uses the identical grid to watch dissolved oxygen, temperature and chlorophyll-a. When a low-oxygen layer forms near the bottom intake, the water-quality team changes withdrawal depth before anoxic water reaches the plant — the taste-and-odour event that fixed monitoring stations tend to miss, because a buoy samples one point while a grid resolves the whole basin. Four fixed buoys will report the surface layer accurately and the developing dead zone not at all.
Basin cross-sections and sediment budget
An agency gauging 15 river cross-sections every month carries a portable catamaran to each site, runs an ADCP zigzag across the channel, and finishes in about two hours per site with one technician — against three staff and a full day with a crewed boat. The repeat lines are identical run to run, which is what makes year-on-year comparison defensible in a sediment budget. Consistency, not top speed, is the deliverable.
Compliance, standards and permitting
Deliverables for water-right and allocation work are normally specified to IHO S-44 Order 1a or better (International Hydrographic Organization, S-44 Standards for Hydrographic Surveys, 6th edition), with RTK GNSS tied to the national datum. Where the same campaign reports ambient water quality, sample handling and QA should follow the field protocols used in the US EPA National Aquatic Resource Surveys; where an industrial outfall falls inside the survey area, discharge data has to line up with the NPDES permit framework rather than being reported as an afterthought.
Before mobilising, confirm in writing: navigation-authority notification, permits for sampling inside a drinking-water protection zone, radio licensing for any band used beyond licence-free limits, and a lockout/tagout procedure for ROV work near submerged intakes. Most crews suspend operations at sea state 3 or winds above 15 m/s.
Deployment workflow
- Survey design (1 day before): plan line spacing at 2–5 times water depth and a 200–500 m CTD station grid.
- Launch and calibration (30–45 min): launch the vessel, run a sound-velocity cast, verify RTK fix quality.
- Bathymetric coverage (4–6 h): run the grid at 3–5 m/s, logging depth, position and quality flags.
- Water-quality profiles (1–2 h): cast the CTD to 0.5 m above bottom and trigger the sampler at defined depths.
- ROV inspection (1–2 h): deploy the ROV on the flagged outlet, intake or dam face and record video with positioning overlay.
- Processing and QA (same day): build the storage-elevation curve and export S-44 compliant deliverables within 24 hours.
Cost and procurement: five-year budgets
Where the money actually goes
Over five years, a representative split is roughly 40% platform and payload capital, 25% crew time and travel, 15% calibration and spares, and 20% software, communications and data management. The comparison that matters is against the crewed alternative, where boat charter, fuel and a three-person crew recur on every single survey and never depreciate to zero.
Crewed boat versus uncrewed platform
| Method | Crew per survey day | Cost per survey day | Spatial resolution | Personnel exposure |
|---|---|---|---|---|
| Spot sampling from bank | 1–2 | Low per visit, high per km² | Single points, no spatial picture | Low |
| Crewed survey boat | 2–3 | $2,000–4,000 | Operator-dependent, hard to repeat | High — currents, weather, contaminated water |
| Assessment USV | 1 | Operator time plus battery charging | Repeatable grid, 30–60 line-km per day | None — operator stays ashore |
At a weekly cadence — about 50 surveys a year — a crewed programme spending $2,000–4,000 per survey day carries $100,000–200,000 of annual boat cost against a system in the $15,000–60,000 band typical of this class. Payback lands inside the first year at that cadence, before any value is assigned to repeatability. At 20 surveys a year the same arithmetic stretches to two or three years, which is the honest way to present the business case to a finance committee.
Selection checklist
| Buying criterion | What to verify | Acceptance threshold |
|---|---|---|
| Volume accuracy | Repeat survey of a reference basin | Storage error < 2% of capacity |
| Positioning integrity | RTK fix retention across the lake | ≥ 99% fixed solutions |
| Endurance | Full-day grid at survey speed | ≥ 8 h with 20% reserve |
| ROV compatibility | Davit lift, tether management, power | 300 m class or deeper |
| Data deliverables | Export into bureau GIS and reporting | S-44 metadata plus CSV/GIS in 24 h |
Ask for a repeat survey of a reference basin rather than a specification sheet: a storage error under 2% on a second pass is the only proof that positioning, sound velocity and draft correction behave consistently. For a configuration matched to your reservoir size, contact the OrcaUSV team.
Frequently asked questions (FAQ)
How accurate is the storage-volume result?
With RTK positioning and a calibrated echo sounder, storage volume resolves to within about 2% of reservoir capacity. Accuracy depends on line spacing of 2 to 5 times water depth and a current sound-velocity profile; skip either and the error grows faster than the survey time saved.
Can one campaign also inspect submerged dam structures?
Yes, when the package includes a 300–500 m class ROV. The vessel completes the mapping grid first, then serves as the deployment platform while the ROV inspects outlets, intakes and dam faces, inheriting the survey positioning for every video frame.
Which water-quality parameters can be collected?
The standard profiling payload measures temperature, conductivity, depth, pH, turbidity and dissolved oxygen on vertical casts, plus discrete 2–5 L trigger-bottle samples. Laboratories extend the same stations to nutrients and metals, and hydrocarbon fluorometry is available for outfall work.
How long does an assessment take end to end?
A 10 km² reservoir typically needs 2–3 field days for bathymetry and profiling, plus 1–2 days for ROV targets, with final storage-elevation curves and GIS deliverables within 24 hours of the last sortie.
Recommended OrcaUSV configurations
- Mapping-led assessment: the XHS50-ADCP ADCP Integrated Hydrographic Survey USV integrates positioning, sounding and telemetry for volume and discharge work on larger impoundments.
- Underwater inspection: the XRV4 500 m Open-Frame Work Class ROV covers deep outlets, intakes and dam-face inspection from the same mobilisation.
- Compact bureau kit: the XHS30 Single-Beam Hydrographic Survey USV suits two-person carry and routine storage surveys on smaller reservoirs and lakes.
All three sit inside the Marine & Water Conservancy solution set, which covers the surrounding procurement scope.